In the UK, the Office of National Statistics does a great job in calculating the house price inflation. However, it lacks detailed analysis of Central London property located in EC & WC postcodes. The average price of properties in this postcode is over £1m, more than 3x the national average and hence follows a different market dynamic. For e.g. the stamp duty holiday has a much smaller effect on total property price.
In this post I will be discussing the property market in this hyper local area, and how it has developed through post COVID in the advent of work from home culture.
The data for the analysis comes via Zoopla For Sale listings and the Land Registry property database. I scrape all the listings of Zoopla and sales on Land Registry daily for this type of analysis.
Number of sales per year
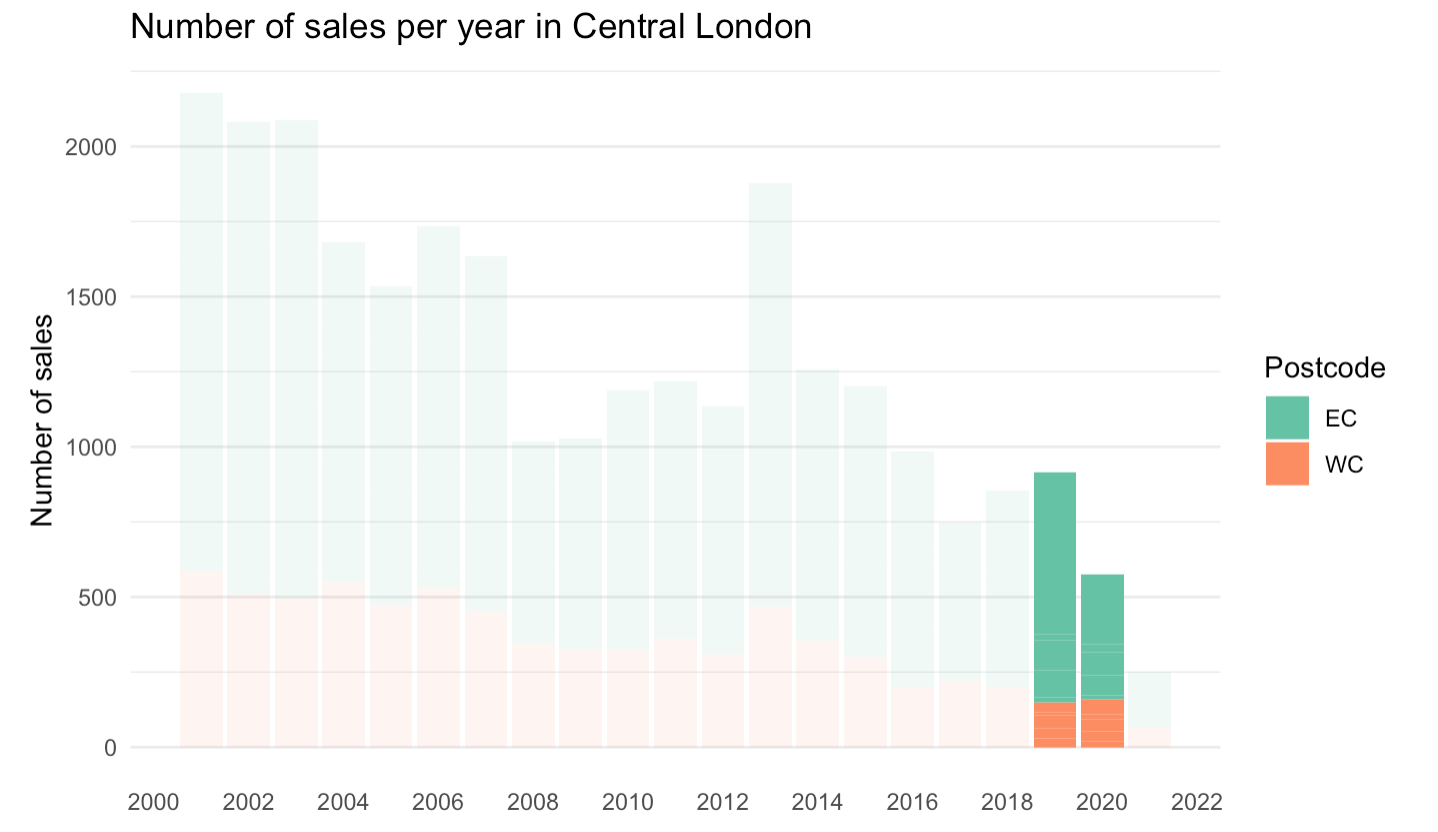
The number of sales per year in EC & WC postcodes have fallen considerably since the 2000s. In 2020 number of sales fell 45% to 417 properties compared to 2019 in EC! However, sales in the WC postcode were actually up at 157 compared to only 147 sales in 2019.
According to the ONS report, number of sales of flats fell 30% in England in 2020 compared to 2019 (most houses in EC/WC are flats). Hence a drop of 40% in 2020 in both EC & WC is significantly larger and hints at a weaker market.
Median prices
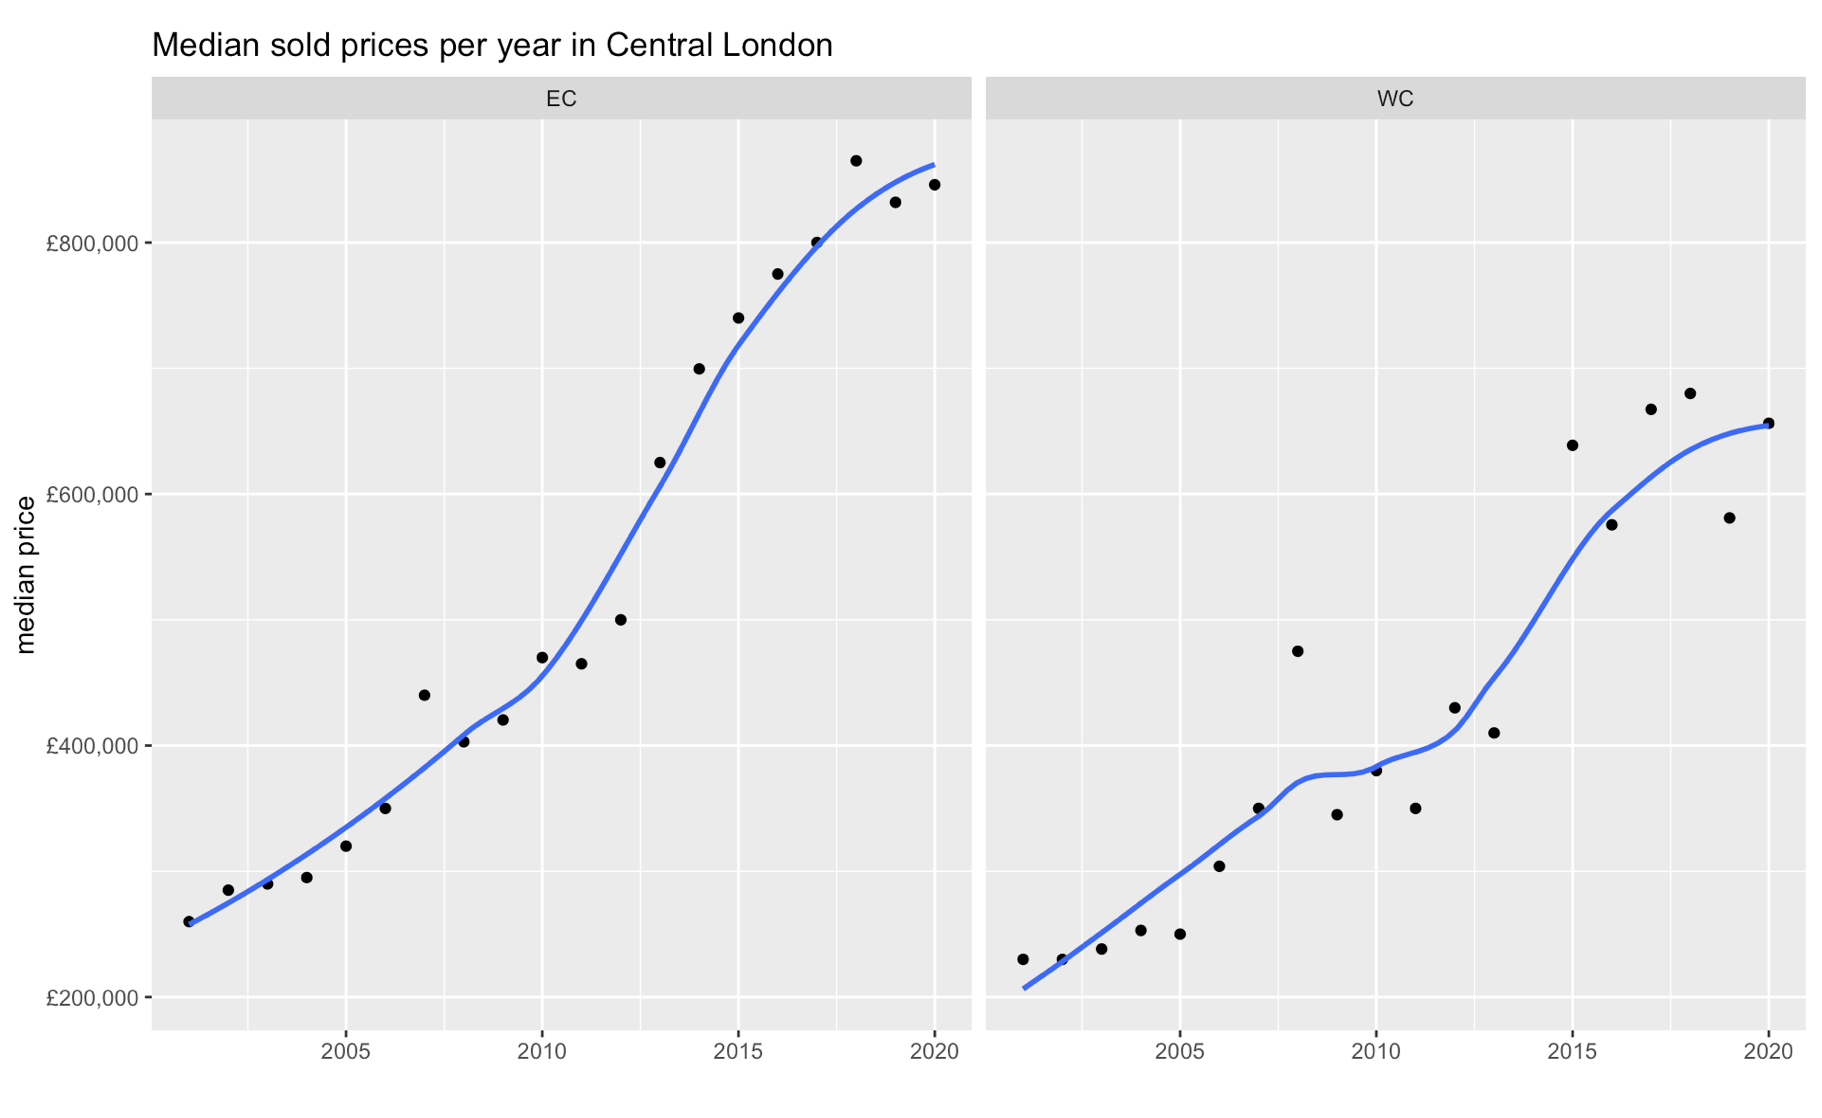
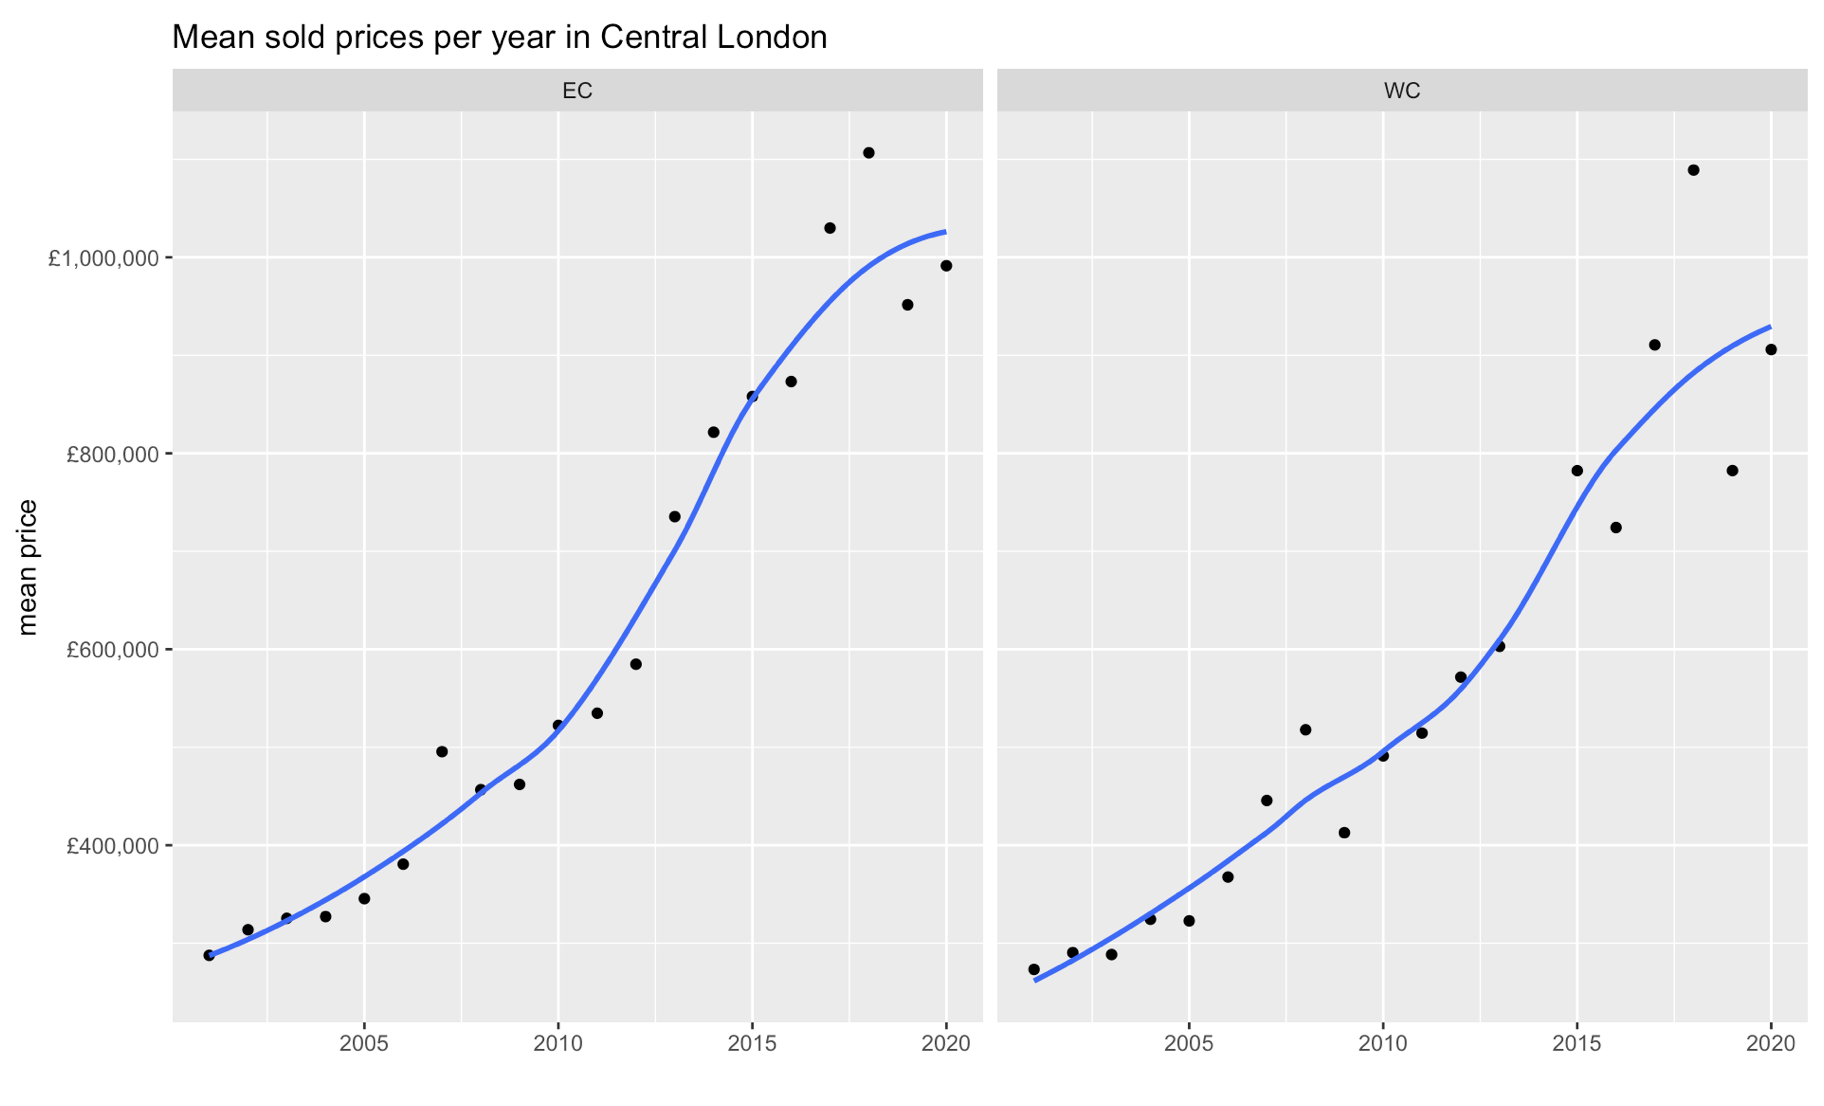
Median prices in 2020 were slightly up in both EC & WC postcodes compared to 2019, and near long term price trend price (in blue). I chose to use median prices as they are less affected by outlier prices of superstar properties compared to the mean average. Nevertheless, both averages (median and mean) show the same trend (see mean below).
These are average prices and are not adjusted for the mix of properties between years. If 2019 had lots of expensive properties sold, it would drag the averages higher but would not necessary mean all prices went higher.
Nevertheless, I think it provides a good indicator showing the property price growth is in line with the historical trend.
Lets drill down deeper into the change in prices between 2019 and 2020. Below is a table which breaks down the statistics by number of bedrooms.
Price Change in 2020 compared to 2019 (EC postcode)
| beds | % change in median price | % change in mean prices |
|---|---|---|
| studio | 8.3 | -3.9 |
| 1 | -2.5 | -0.8 |
| 2 | -0.6 | -0.4 |
| 3+ | 32.0 | 53.5 |
The price (when looking at median and mean together) seem to be unchanged for studio to 2 bedroom flats but have increased significantly for 3+ bedrooms. This makes sense as people move to bigger properties to accommodate WFH.
Price Change in 2020 compared to 2019 (WC postcode)
| beds | % change in median price | % change in mean prices |
|---|---|---|
| studio | 1.6 | 1.9 |
| 1 | 4.8 | 8.5 |
| 2 | 8.2 | -4.8 |
| 3+ | 7.2 | -23.4 |
In WC, prices seem to have increased slightly across the board.
According to the ONS, prices in England are up around 15% compared to 2019. If the prices of a 1-2 bedroom appartment in EC & WC postcodes is roughly unchanged in the same period, the owners in the area are down 15% in real terms compared to the rest of England.
Price reductions
Of the 828 sales since 2020, around. 484/828 sales were found on Zoopla and out of the 484 I have the For Sale data on 270 of them. It is surprising to see only 60% (484/828) of sales actually happening in a public way, the other 40% of sales seem to be happening privately in EC/WC postcodes.
For these 270 sales we can analyse the final price compared to the initial asking price and also the time to sell.
Time to sell and average price reduction in EC/WC sales in 2020/21
| beds | number of sales | % median price reduction | median number of months taken list and close | % of sales where price was reduced | % of sales where price was reduced by more than 15% | % of sales that took more than 9 months to sell |
|---|---|---|---|---|---|---|
| studio | 35 | -7% | 7.4 | 89% | 17% | 37% |
| 1 | 110 | -6% | 6.4 | 79% | 13% | 30% |
| 2 | 80 | -6% | 5.6 | 71% | 14% | 30% |
| 3+ | 45 | -7% | 7.2 | 78% | 16% | 27% |
Note: the sale date of a property is extracted from the Land Registry which provides the date the contract was exchanged. According to Zoopla it takes 3-4 months to a close a property sale. The time taken to sell in the above table is the date between the first listing and contract exchange.
Time to sell
First of all, it is surprising to see 5-8 months to list and close a property sale. This does include the contract exchange period of 3-4 months, so perhaps the time to get an offer is around 2-4 months. According to a report by The Advisory group it takes 2 months to get an offer, depending on the state of the market. So it seems 2-4 months for an offer in EC/WC is representative of a somewhat bear market.
Median price reduction
The median price reduction of 5% seems believable with over 75% properties accepting a lower offer than advertised for sale price. This is truly surprising and confirms that the market is definitely challenging. Furthermore, around 15% of the properties were sold at a 15% discount.
As one would expect, there is a correlation between the discount and time on the market.
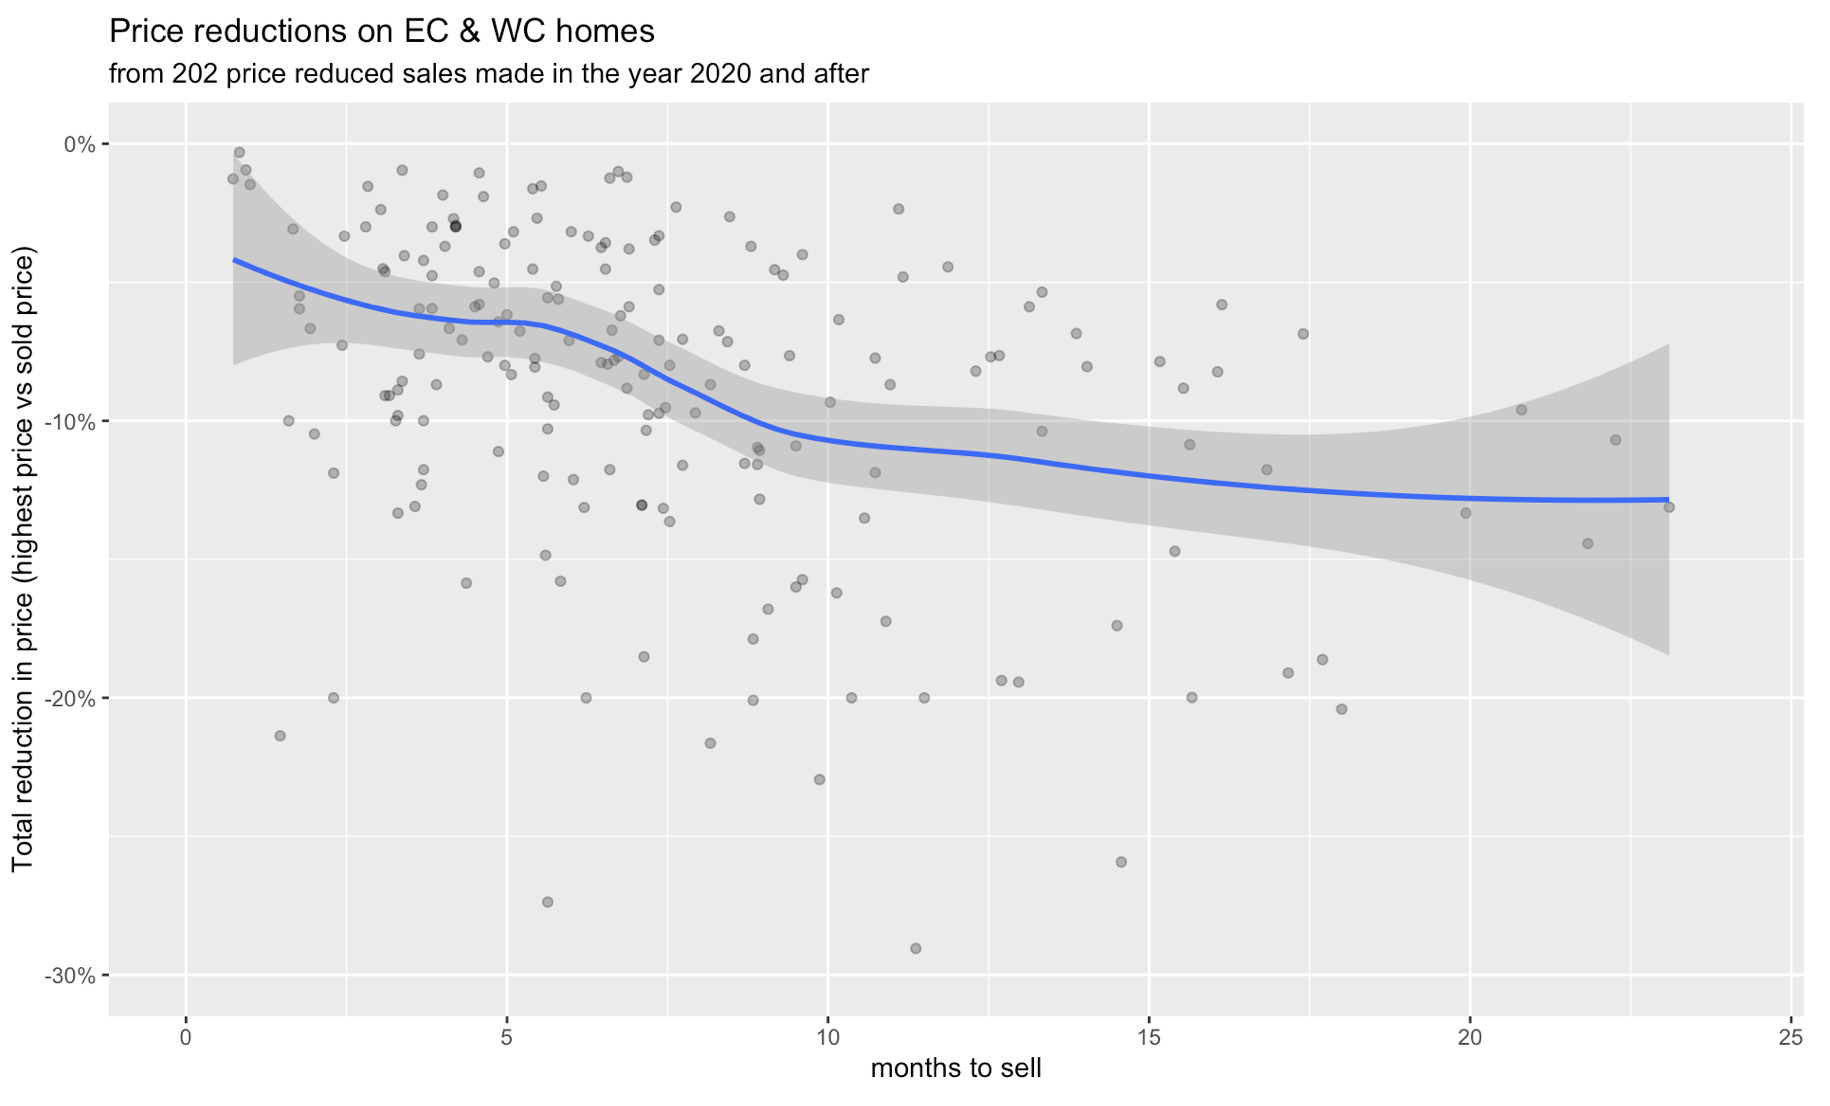
Properties that took around 10 months to sell were sold at an average of 10% discount. If we assume that the property took 3 months to close, the property that took 10 months to close was on the market for 7 months. It seems 6/7 months is the threshold when sellers decide to lower the price for their property further.
Surprisingly, the chart shows that a 5% discount seems to be a normal discount if the property is not sold almost instantly after listing. There could be many reasons for this, perhaps sellers list with a 5% higher price initially or that the market is weak and sellers are accepting whatever they can get.
Conclusion
The data seems to suggest that the property market in EC/WC has been quite weak since 2019 with prices of small properties not increasing at all. This is in stark comparison to the rest of the UK where prices are up 15-25%.
On the other hand, its reassuring that the market has not collapsed completely. The # of sales are down 40% in 2020 but that’s because of the 5 month COVID-19 lockdown in 2020. Prices are stable despite a lot of stories about people moving to the countryside and working remotely.
Appendix
The code for this analysis can be found on my personal Github.