The problem
Browsing listings on Zoopla or Rightmove leaves me with more questions than answers. Whilst looking at listings, my major gripes have been:
- Why can’t I filter by internal space area?
- How long has this been on the market for?
- Has the seller reduced prices?
- What was it last sold for?
- What are normal prices in this postcode? Is this property cheap or expensive compared to the average?
Both Zoopla and Rightmove have tried to aggregate points 2-4 into listings to give prospective buyers a good analysis on any property. Zoopla have ‘Sold prices’ and ‘Listing History’ for each property on sale. But, a lot of listings are not aggregated because sellers do not want to show that they have reduced prices or link their listing to the original buy price. Hence, a lot of the times, the ‘Listing History’ presented is incomplete. I have experienced this personally having offered asking price for a property without knowing that the property was listed for over 2 months without a sale. In this case, the previous listing was deleted and I only saw the new listing making me think that the property was ‘fresh’ to market. Of course, the estate agent went along with this, pressing me to place an offer ASAP!
Hence, my primary aim is to index every event on a property such that one can have complete visibility into any property that may have been listed for sale. In addition I want to be able to search and analyse properties by internal area without having to manually click on each floorplan.
The solution
I have created the property explorer app: http://property.sbikram.com
Currently you can use it to browse listings in the EC & WC postcodes of London. This is just an alpha test and I hope to add more postcodes to the app soon. If you have any feedback or ideas, feel free to contact me on @saurabhbikram.
Now, lets go through the features!
Features
The app has basic features for searching similar to Zoopla or Rightmove. If location services are turned on it will try to guess your postcode, otherwise you can enter any postcode of interest. I will highlight some cool features below.
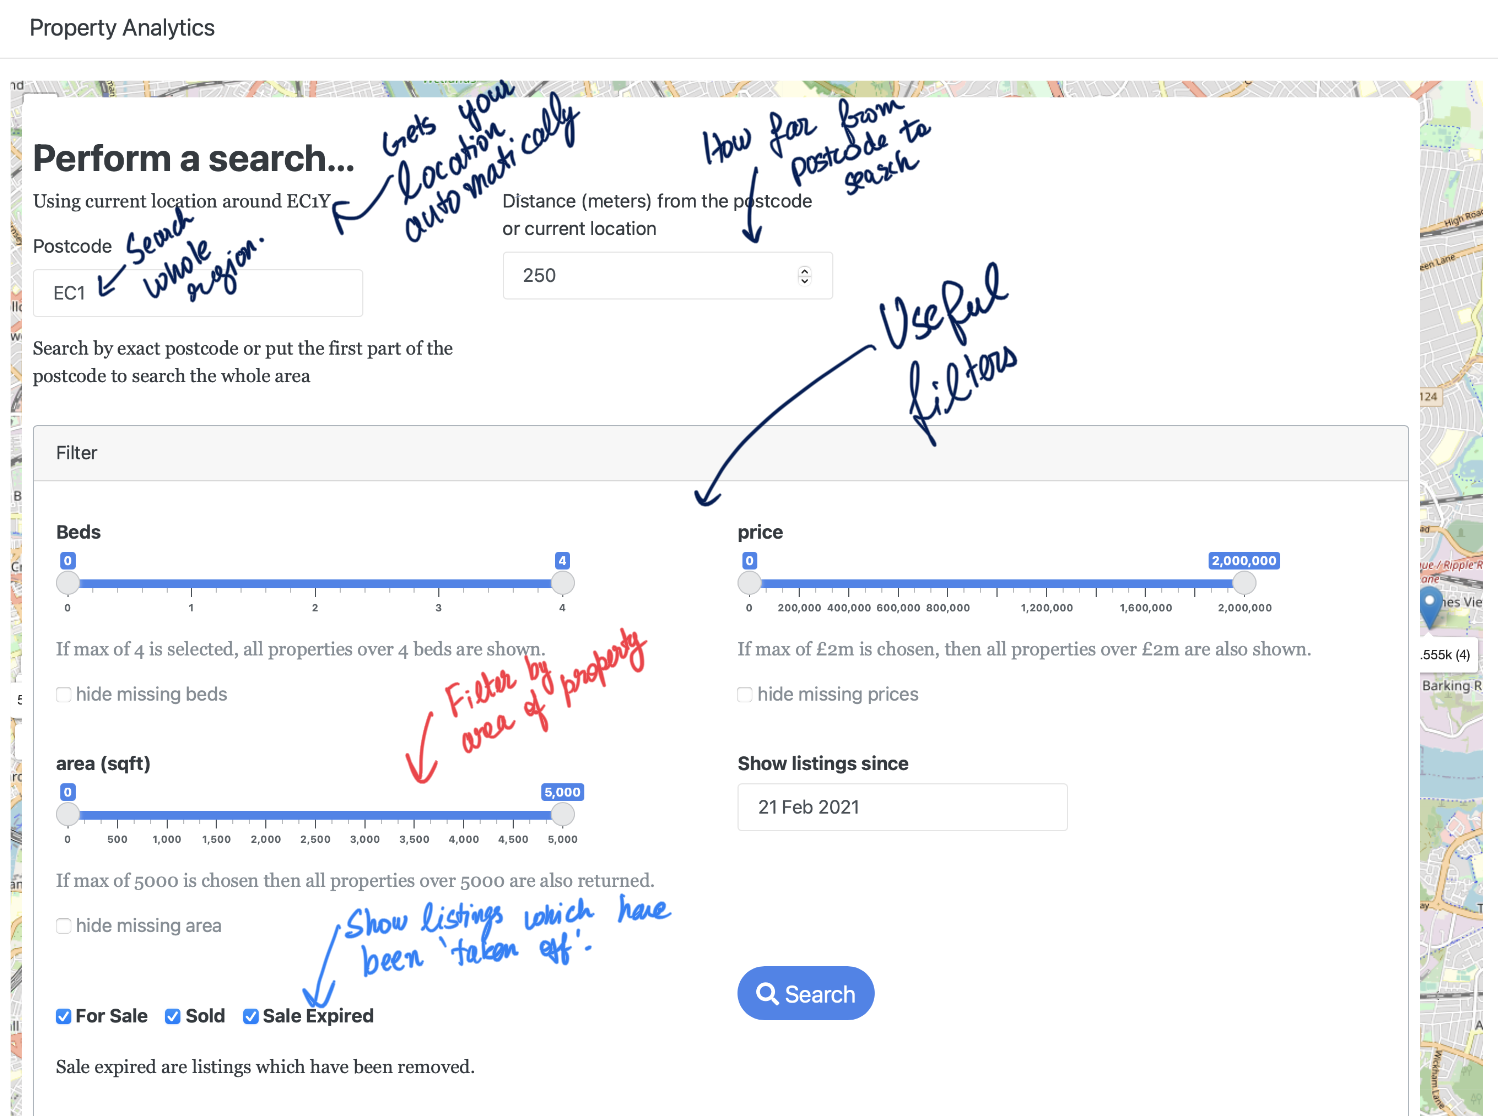
1. A more useful search
The first screen you are greeted is a simple search screen. The unique selling point here is:
- ability to filter by area of flat.
- see listings which have been deleted off Zoopla ‘Sale Expired’
See below how to ‘fill’ the search:
After clicking Search you will be met with multiple markers on a map where each marker represents a unique property. I will discuss this further on the next blog post!
2. Summary analytics
For any search result set you can analyse quick summaries. For example, here I searched for all sold listings in EC1 after 21 Feb 2020 and then clicked on visualise layers button to see three useful charts:
- Chart 1: How many properties sell every week?
- Chart 2: What is the distribution of sold prices?
- Chart 3: What is the distribution of beds ? Are there lots of 2 beds ?
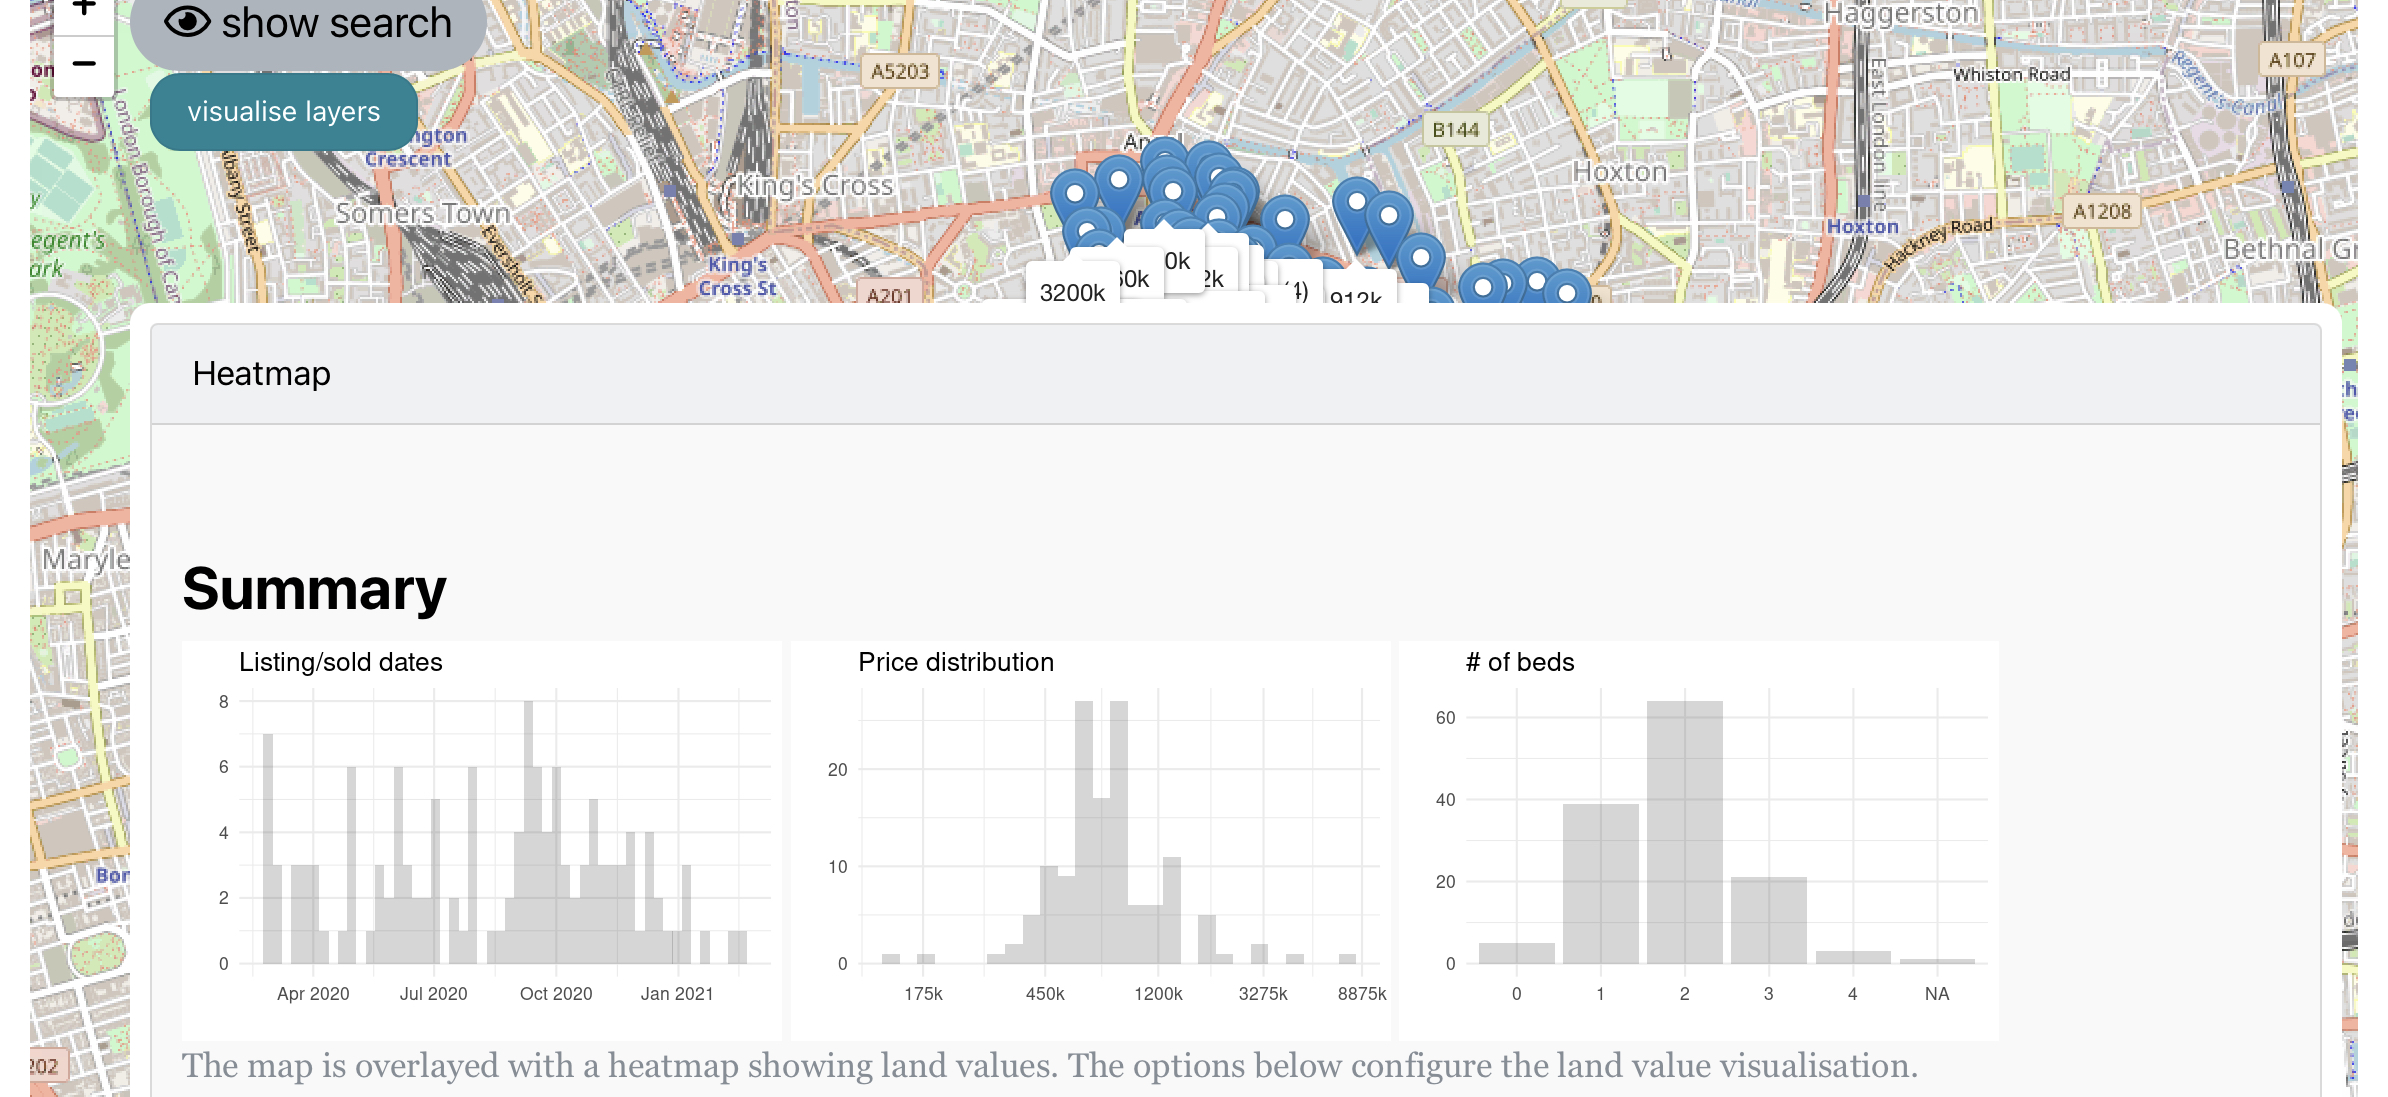
As a buyer or seller it is useful to know the going rate for properties. By editing the search you can retrieve some powerful analysis. For example:
- Number of 1/2/3/4 beds sold in the last 5 years - check supply in the market.
- Distribution of prices for ‘For Sale’ listings of 1 bed room properties over 500 sq feet in the WC1 postcode since March 2021.
- Do the above but in March 2011 and see how prices have changed.
As you can see the possibilties are endless!
3. Average price per sq feet
The primary way to value a property is to get the local price per sq ft and multiply it with the area of the property to get a ball park figure for the value. On my app you can get granular price per sq ft, at the postcode level - unlike most other apps. I have overlayed this information on top of the listings as a heat map. As you hover over the heat maps, you will see the average price.
In the example below, I am looking at ‘For Sale’, 2 bed properties in the EC1 region. The overlay colour represents the average price per sq ft in that postcode from the search results (it is £1,100 per sqft). You can see that some areas are yellow (cheap) while others are red (expensive).
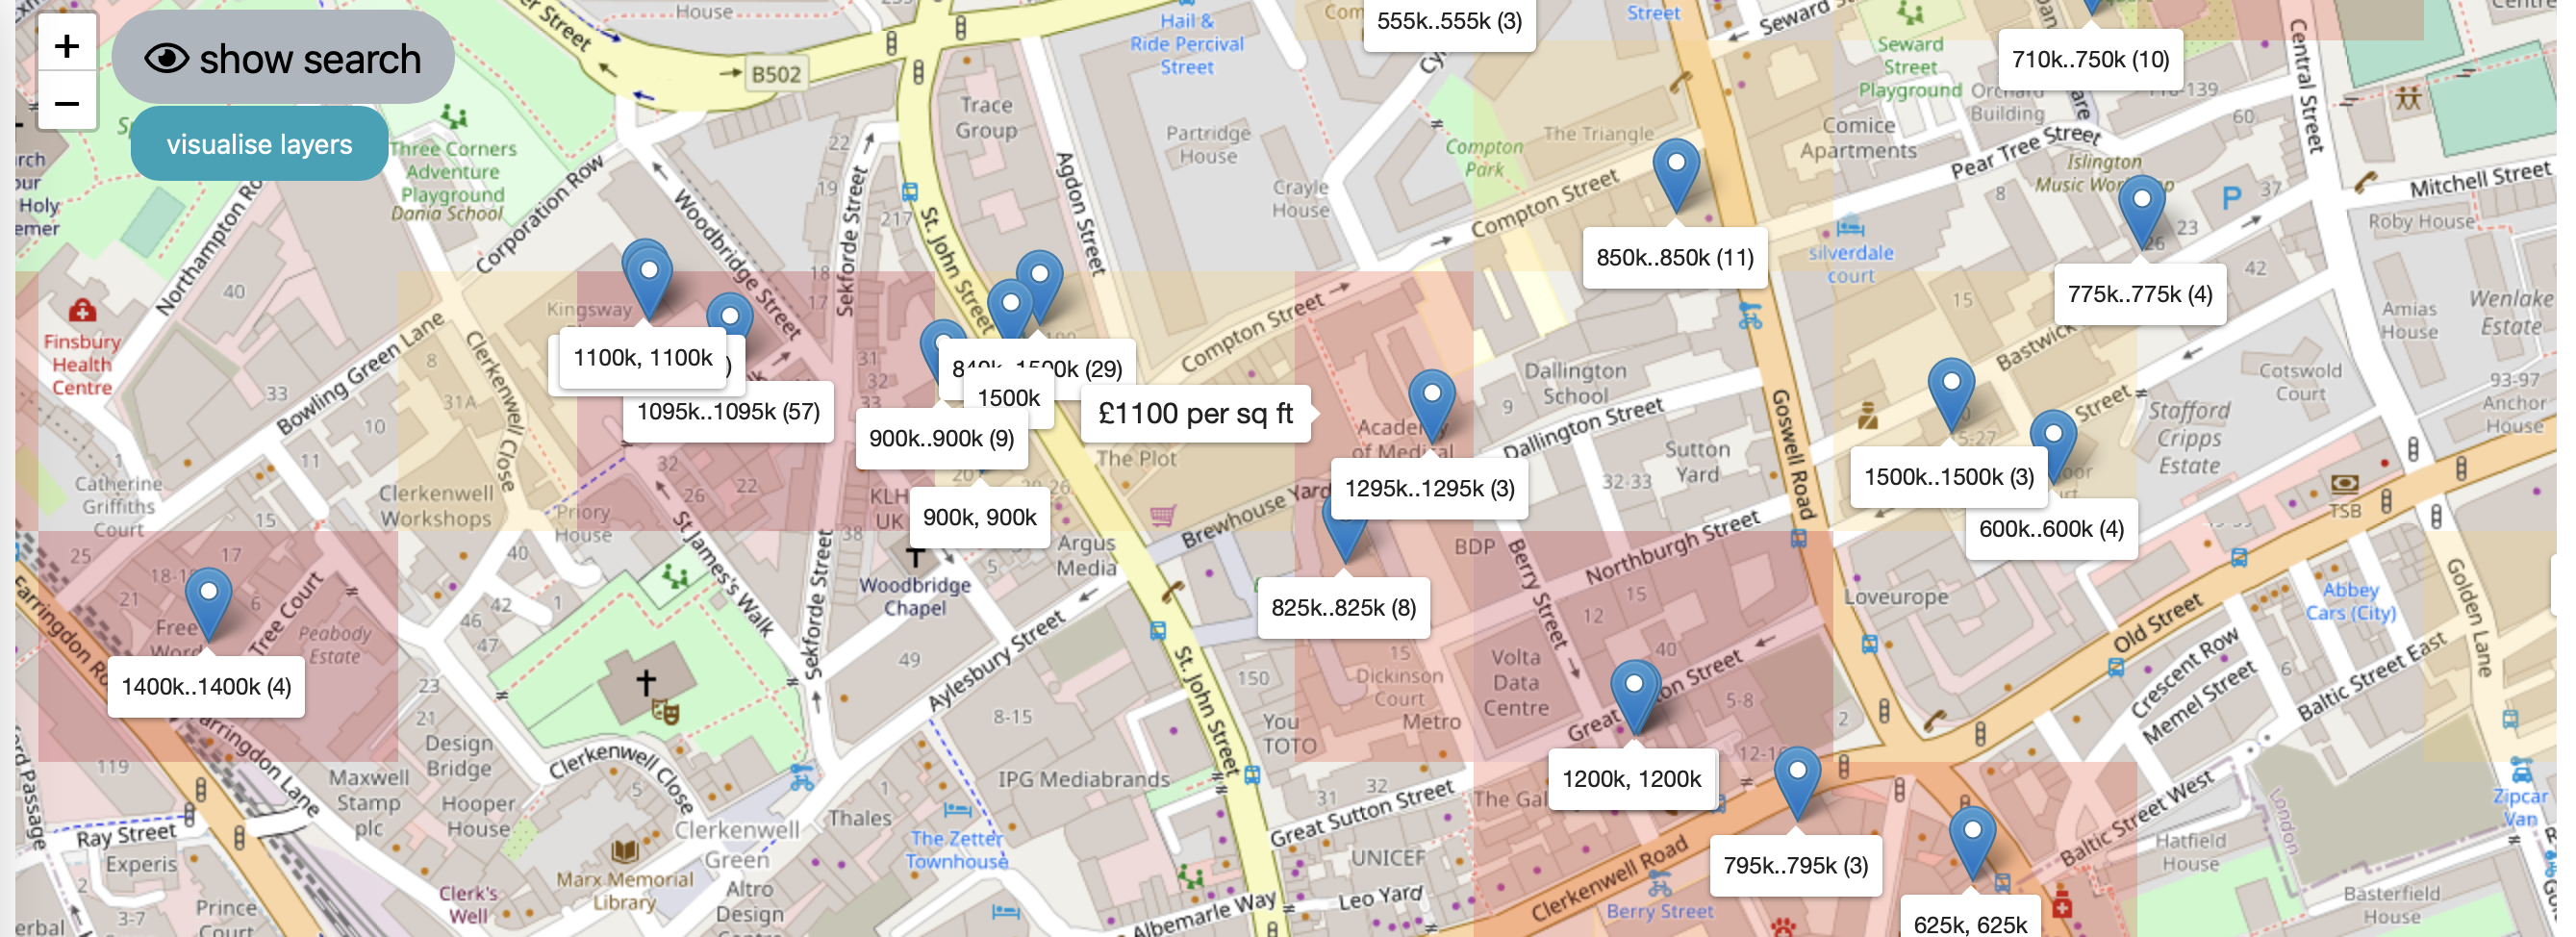
Since the visualisation reflects the search result set, changing the search parameters can change the heatmap color and values. This is very useful as you can get quite creative with the filters. My favourites are:
- See average sold prices per sq ft in last 5 years in a postcode
- See current for sale prices per sq ft based on ‘For Sale’ listings
- Compare 1) and 2)
- Do the above, but now just look at 1 beds or 2 beds.
Going 1 step further…
There are lots of missing heatmaps in the above image because there are no properties in the search results for that postcode. So, I have gone one step further and created a model using machine learning which infers prices of a postcode using all sales and asking prices to date. It will then adjust the price you see based on the # of beds you have selected in the search, so that the price you see is coordinated with the number of beds in the search.
As you can see below, the model will predict the going price per sq feet for any postcode area. It gives a really useful heatmap showing areas that have higher values than others. Since they are model based, the heat map is robust to outlier sales. In this case, it gives the same value of £1,100 per sqft for the area (near Compton Street) as the above raw heat map.
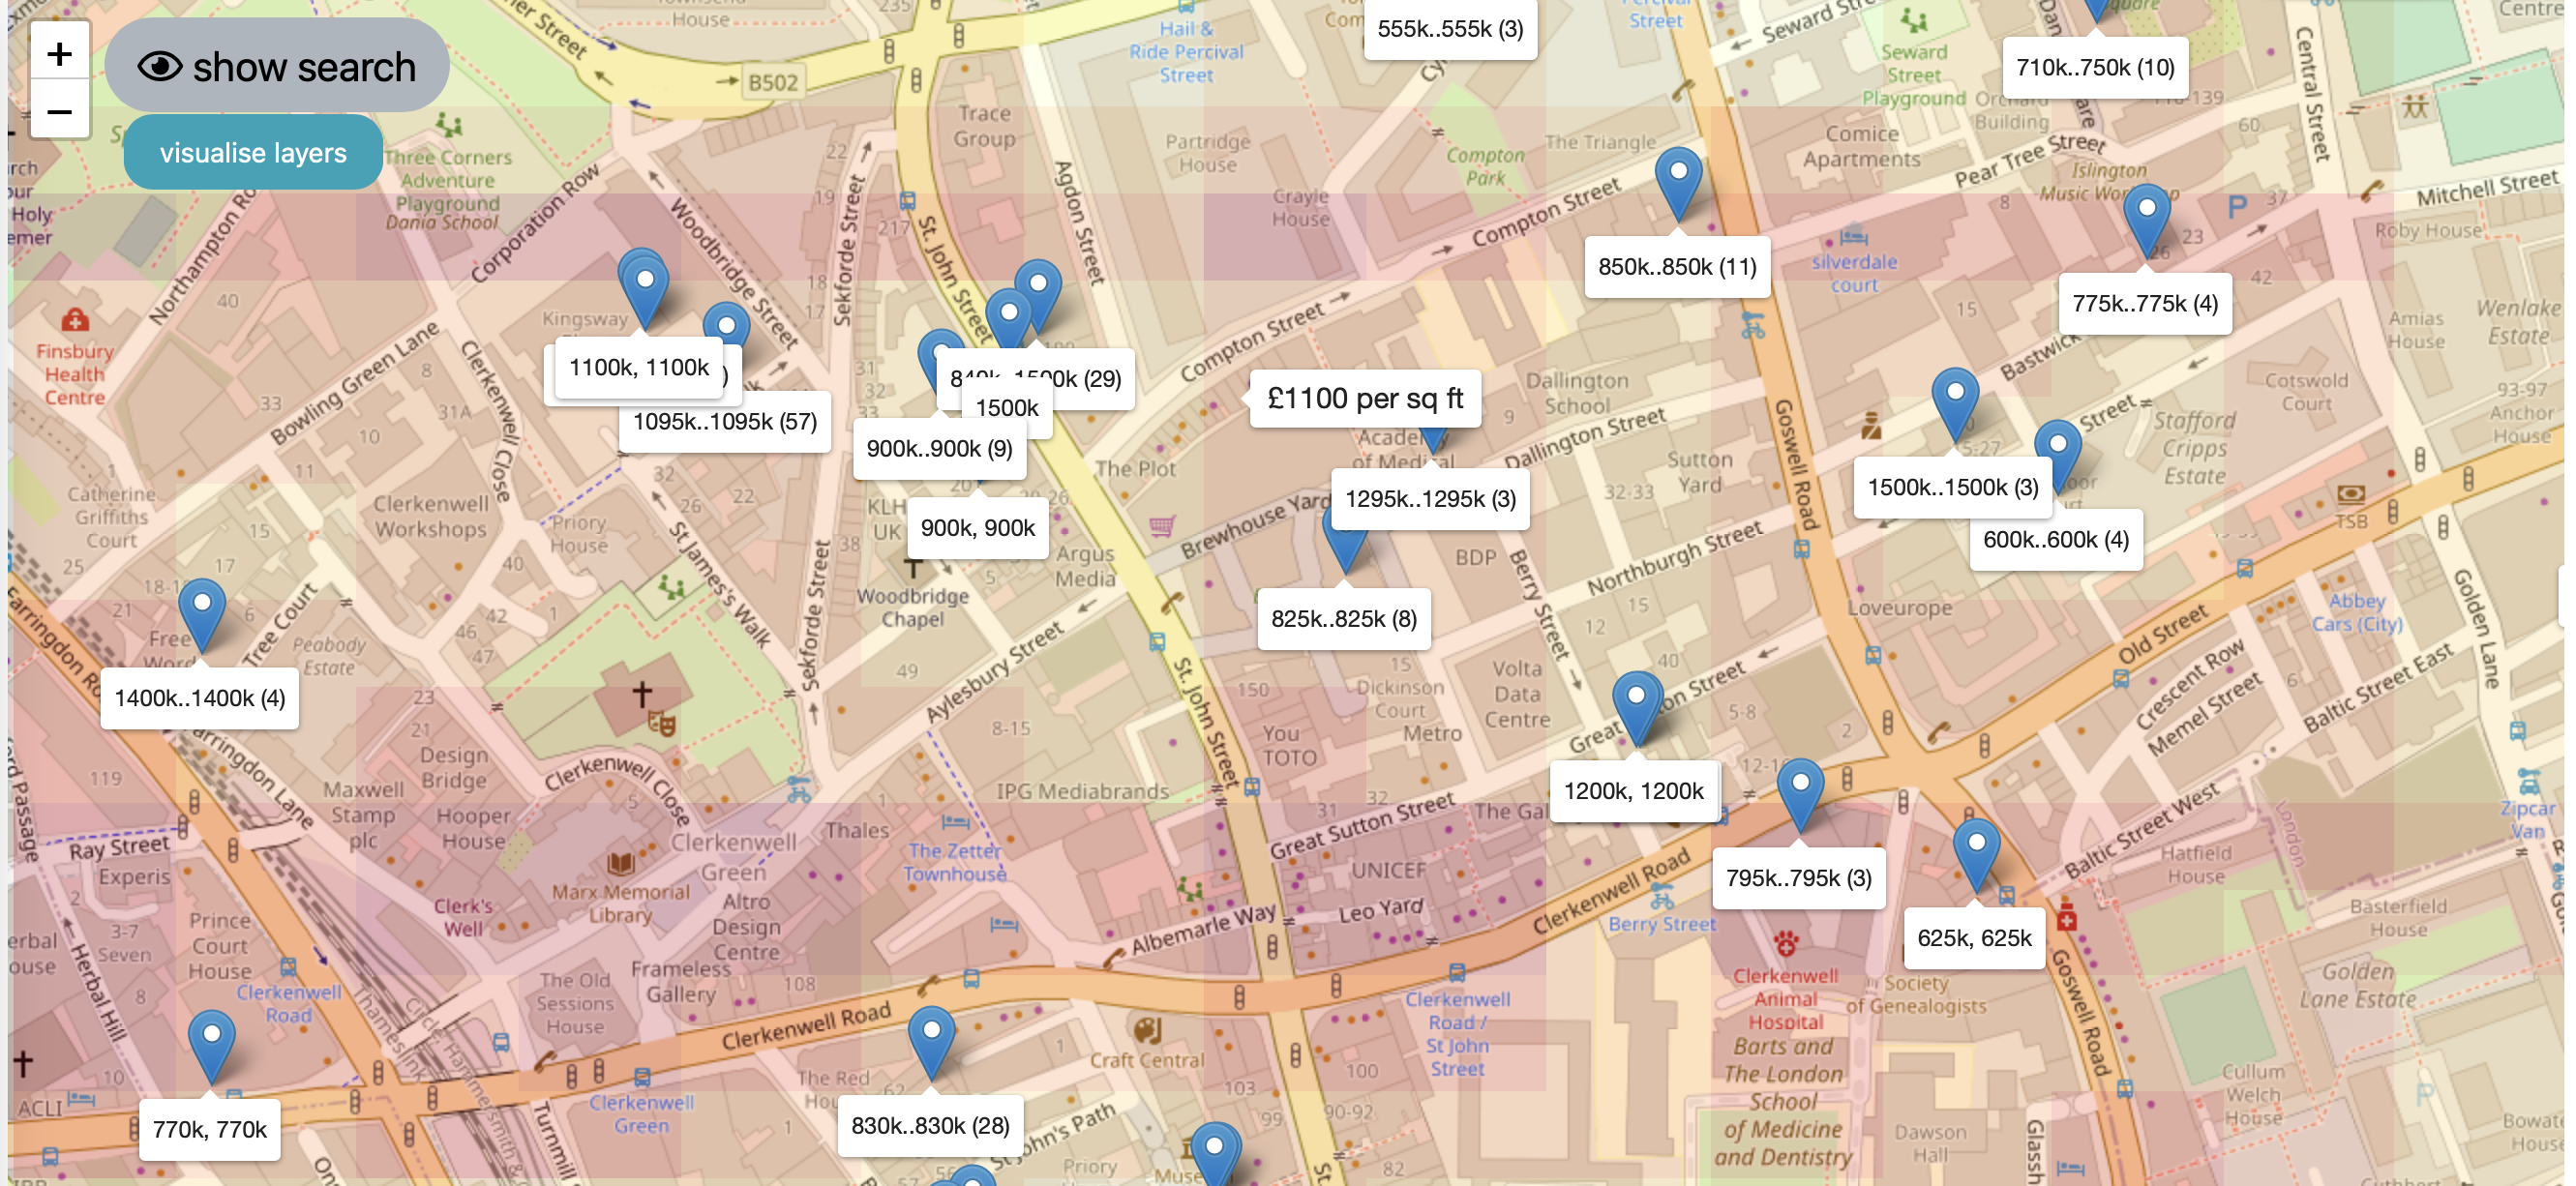
This option can be accessed by clicking
visualise modeland then picking theadjustedoption in the first set of radio buttons (underOverlay with land value type). Switch back to non model based by clickingraw. Remove heat maps by selecting thenoneoption. There is a furtherresolutionoption - the lower this number the smaller the area that each heatmap rectangle covers, giving more granular prices. However, if there are too few sales, the prices will be very noisy as the estimate will be based off only 1 or 2 properties.
Coming up next in part 2
The next part will discuss what happens when you click on a property.
I would love to hear any comments or feedback! Feel free to drop me a message on @saurabhbikram.